Profiling Processor Cache Misses with VTune
August 06, 2019
I heard about VTune a while ago as a processor instruction level profiler, but I never got the chance to play around with it. This blog - and maybe others in the future - will narrate my trials to get a hang of VTune.
First things first: What is VTune
VTune is a profiler capable of a similar job to CPU sampled profiling in XPerf or Visual Studio debugger, with a significant edge: it supports hardware-based event sampling, using a special chip on Intel processors called the Performance Monitoring Unit (PMU). Using events reported by the PMU, VTune can give an in-depth look into an application’s performance, and a general “verdict”, such as being front-end bound or back-end bound.
While OS-reported CPU usage levels are effective most times, the time comes when we need a deeper insight into what is happening on the hardware level. In my experience, this is most beneficial in tight loops or portions of the code on an ultra-hot path: those 50 lines of code responsible for more CPU usage than the thousands of lines in the rest of of the application, it is for those 50 lines that VTune can come in handy.
Getting VTune
I was pleasantly surprised to see that personal use for VTune has become free, until recently it was only a 30-day evaluation. The 2019 edition comes with a sleek GUI and great integration with Visual Studio. Using VTune from within Visual Studio is straightforward and fits nicely into my usual development cycle.
Let’s Take VTune for a Ride: Cache Misses
We’re always told to build applications to be cache-friendly, but such things are easier said than done. Now, if we can detect being non-cache friendly and fix it, that’s powerful. For my first VTune experiment, I want to explore if it can detect cache unfriendliness.
Row-Major and Column-Major 2D Array Traversal
A classic example for cache misses is the 2D array traversal problem. Say, we need to find the sum of all elements in an array, we could either loop on rows, or on columns:
// row major traversal
for (int i = 0; i < numRows; ++i)
    for (int j = 0; j < numColumns; ++j)
        sum += matrix[i][j];

// column major traversal
for (int i = 0; i < numRows; ++i)
    for (int j = 0; j < numColumns; ++j)
        sum += matrix[j][i];
To choose a row or a column-major design depends entirely on how the matrix is represented in memory. Assuming matrix is an array of pointers (e.g. int** or a vector<vector<int>>) the column major traversal has a huge issue: it will trigger vastly more cache misses than row-major traversal.
For an overview of what’s a cache miss and CPU memory access costs checkout “Why do CPUs have multiple cache levels?”
A picture makes things easier:
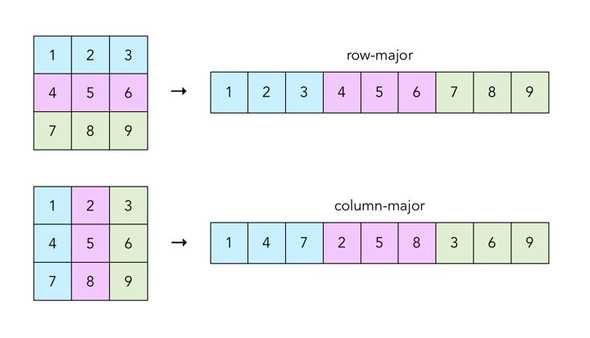
When code tries to access element 1, processor fetches it from the main memory into the cache, and adjacent elements 2 and 3 are fetched as well, which comes in handy as code accesses them next. However, a column-major pattern accesses 4 afterwards, not using 2 or 3 that we already have in cache, and incurring an additional memory access.
Note that the above is a toy sample, and there need be over 3 elements per row, otherwise the whole array could be cached after the first element access.
How Slow is This
To test the effects of array access pattern, I used a tiny app that builds an array, then tries to sum its elements several 1000 times, to emulate a real CPU load. I created two versions, one with row-major and one with column-major access for the array, code for both is on github. Then, I ran both examples for varying array sizes:
The graph shows that as array size goes beyond several elements, where the whole array might even be cached, row-major access is the very clear winner. Now that we have a ripe test case, let’s see how VTune can profile this.
Profiling with VTune
From Vistual Studio, it is straightforward to trigger a VTune profile by clicking Profile with VTune Amplifier, adjusting config, then clicking Start:

Note using Microarchitecture Exploration under the How, as VTune can do User-Mode sampling, but I would rather use XPerf or F1 for that.
One more note is to make sure to set paths for system symbols. While VTune interface does not stress adding them, results were useless without system symbols:


One last note - VTune also supports profile using a portable executable, allowing for capture & analysis to happen on different machines.
A profile capture is now ready - let’s have a look at the results!
Column-Major Access
In this test, I used an array of size 2048, and ran that operation for 200 times. Running VTune for the app resulted in:
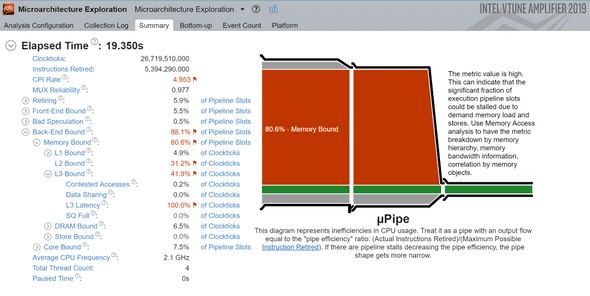
As trivial as this example is - I was impressed by the verbose verdict. The Memory Bound red box aligns well with our expectations, we’re accessing too much memory and too little cache.
Row-Major Access
Next, I ran same app with a small change in indices used to access the array:
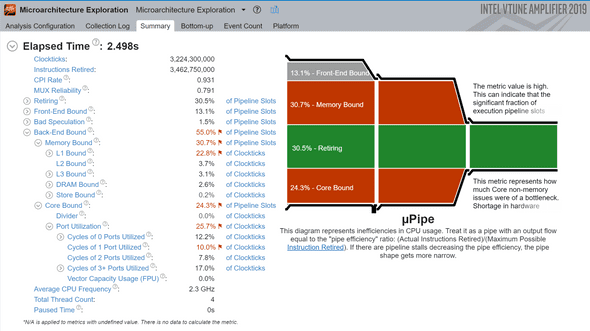
Note the “Elapsed Time” of 2.5s, a 7x speedup over the row-major test. Furthermore, the 30.5% Retiring box (in green) represents the percentage of instructions the processor successfully predicted & executed, a higher number represents more efficient execution - again aligning with expectations.
VTune makes it clear this is by far not a perfect implementation and shows two red boxes. The red Core Bound box below represents backend non-memory issues, in our case probably referring to missing out on vectorizing instructions for array traversal and sum. The other red box, Memory Bound probably refers to the inter-dependency of our stores: all array accesses are appended to the same variable sum, and dependent stores are hard to parallelize.
Detour: Trying a Naive Fix
Before signing off, I tried one more interesting experiment. The last profile had pointed to a memory bound, and I wanted to see if I could improve the code - in the silliest way possible. I replaced the single storage variable sum with an array, and hence, artificially decreasing instruction inter-dependency:
// Before
int GetSum(const TMatrix& matrix)
{
    int sums = 0;
    for (int i = 0; i < matrix_size; ++i)
        sum += matrix[i];
    return sum;
}

// After
int GetSumArr(const TMatrix& matrix)
{
    int sums[4] = { 0, 0, 0, 0 };
    for (int i = 0; i < matrix_size; ++i)
        sums[i%4] += matrix[i];
    return sum[0] + sum[1] + sum[3] + sum[3];
}
Now let’s re-run VTune:
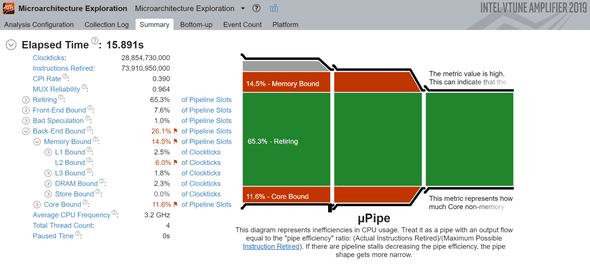
And we achieved the goal: retiring instruction rate has doubled, but at a very severe cost: it’s much slower, and on top of that, VTune report looks counterintuitively better.
This is not a surprise - quoting the docs: “a high Retiring value does not necessary mean no more room for performance improvement.” It just means the instructions are being run efficiently but those instructions might be bloated, as in our code above where we’re executing a lot more instructions that needed.
Elapsed time above is not accurate as I have increased number of total runs to get more accurate summary from VTune. Actual comparable runtime is about double the row-major access.
Conclusion
I am impressed with VTune so far and wonder how does it scale for profiling production scale applications. Nonetheless, VTune is educational, I have learnt a bunch about hardware, even though I ran one of the simplest examples possible.
Code samples & VTune captures for those interested in further debugging are in the post material. Thanks for reading!
Help improve this text or discuss it on reddit, hackernews.

This is Ahmed Mahdy, and these are some of my thoughts, mostly on optimizing performance. Contact me on Twitter